
Why Metrics for News?
Metrics for News aligns journalism metrics with your editorial values and business model. This strategic tool complements real-time analytics by identifying patterns across all your data sources and helps news leaders find places to better align everyday coverage to longer-term audience engagement goals.
Click visuals to view in detail.
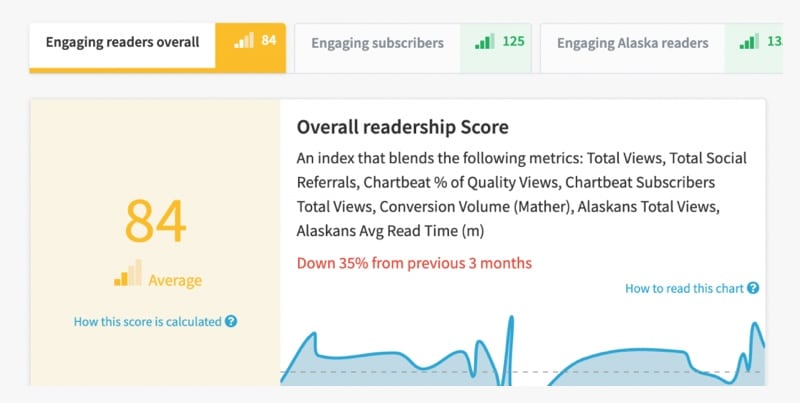
Engagement scores
Blends multiple metrics into one number to offer a simple yet comprehensive view

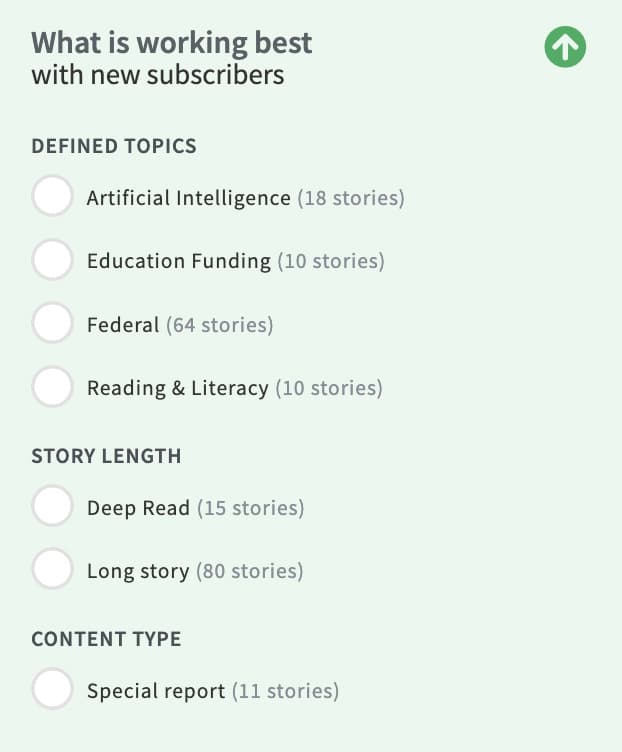
Artificial intelligence
Identifies actionable patterns by categorizing content

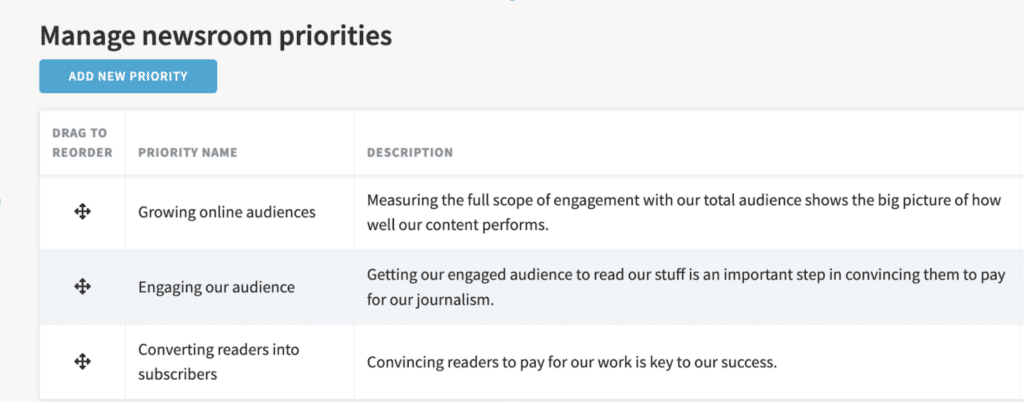
Newsroom priorities
Evaluates content against larger strategic organizational goals

Understand reader engagement
Learn how and why readers engage with each author or team’s content
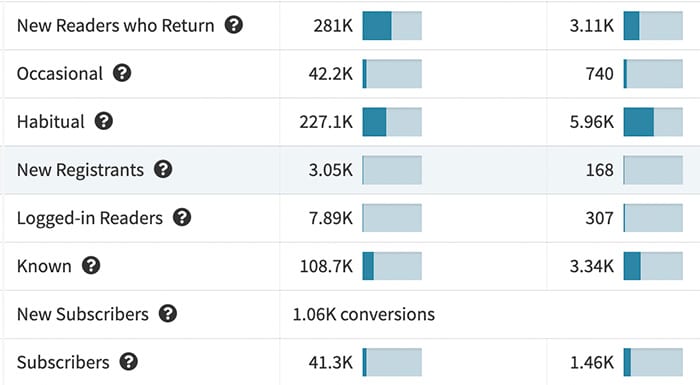
Access custom funnel analytics
Track journalism qualities
Spot subscriber-converting stories, topics and formats that build loyalty
Identify what types of journalism to do more, do less or do differently
Segment key audiences
Segment audiences by location, age group and more
Tailor analytics dashboards for reporters, editors and other roles in your news organization
“Metrics for News is an invaluable part of our toolkit. It organizes our data, our journalism and our audience in ways that make actionable insights almost impossible to miss. Frankly, I couldn’t imagine crafting or executing a newsroom strategy without it.”
“While we have several data sources, Metrics for News offers the context needed to analyze our efforts to best serve our communities. It blends the data so editors can make strategic decisions for better coverage and engagement. The dashboard also serves as a learning tool for our journalists to better understand how their work contributes to newsroom goals.”
This is the tool that has the most success for us in changing reporter behavior.
“Metrics for News is an invaluable part of our toolkit… It organizes our data, our journalism and our audience in ways that make actionable insights almost impossible to miss. Frankly, I couldn’t imagine crafting or executing a newsroom strategy without it.”

